Controversy and confusion surrounds this subject as there are many ways of expressing and presenting pH disturbance of the blood. Much of the literature deals with conflicting claims of superiority of one method over another.
It seems to me that one can deduce from any of the current methods of measurement on blood, the direction and to a lesser but acceptable extent, the magnitude of changes in the whole organism.
In practical clinical situations we want to know the direction of change, the size of the change and how it alters with time, physiological events and treatment. In such circumstances only large abnormalities are important.
At present the most popular system of description is that proposed by Astrup et al (1960) which uses pH, PCO2, base excess and/or standard bicarbonate. For reasons of logic this system is not described first. It must be emphasized that all the systems are compatible, so that results from one system can be converted to another by mathematical manipulation. In particular if base excess is positive both standard bicarbonate, non-respiratory pH, serum bicarbonate and total carbon dioxide will be greater than normal and vice-versa.
It is logical to analyse blood for abnormal quantities of acids or
bases which can cause changes in pH, e.g. lactic acid level in lactic
acidosis or to quantitate part of the acid or base, e.g. Cl![]() level in pyloric obstruction. Some of these investigations are not
routinely available, e.g. keto acids, and in most clinical situations
are unecessary as the chemical cause can be deduced from other
clinical evidence.
level in pyloric obstruction. Some of these investigations are not
routinely available, e.g. keto acids, and in most clinical situations
are unecessary as the chemical cause can be deduced from other
clinical evidence.
Most clinical disturbances can be understood by deciding if the blood pH has changed and whether or not CO2, or other acid or base changes are the primary cause.
When there is more than one possible chemical cause for a change in pH and management of the possible chemical causes differ, it will be essential to chemically differentiate the possibilities, e.g. some cases of diabetic acidosis where either lactic or keto-acids may be involved.
The simplest way of describing pH status abnormalities is in terms of actual pH and PaCO2 . If the actual pH is low, the primary disturbance is probably one that would lower the pH (i.e. an acidosis). If as well, the PCO2 is high, it is a primary respiratory acidosis; if low it must be a primary non-respiratory acidosis.
Table 4.2.1. shows the possible combinations of actual pH and PaCO2.
|
Actual pH |
PaCO2 |
Primary pH Status |
|---|---|---|
|
|
|
|
|
|
|
|
|
|
|
|
|
|
|
|
|
|
|
|
Use the Siggaard-Andersen nomogram when reading this section. This is supplied by Radiometer, A/S, Emdrupvej 72, Dk2400, Copenhagen, Denmark. This is the preferred method of quantitating pH or acid-base status.
pH in the blood may be altered by changes in the quantities of
carbonic acid and/or acids other than carbonic or bases. Actual pH
(pH of anaerobically collected blood), and
[H2CO2] (i.e.
PaCO2) are standard clinical laboratory
estimations. The changes in pH due to non-respiratory acids or bases
are estimated by measuring the pH of the blood in vitro having
corrected the PCO2 to 40mmHg. This parameter
is called the non-respiratory pH (Siggaard-Andersen,
1962). It was recognised by Jorgensen
and Astrup (1957) who used it to calculate standard
HCO3![]() . Nunn (1962) called it reduced
pH and recognised that it was a valid indication of non-respiratory
acid-base status but he did not emphasize the idea. Pierce
(1966) called it eucapnic pH, and advocates the system of
expression used in this book. Hasselbalch
(1918) also proposed the same thing (Siggaard-Andersen
1967).
. Nunn (1962) called it reduced
pH and recognised that it was a valid indication of non-respiratory
acid-base status but he did not emphasize the idea. Pierce
(1966) called it eucapnic pH, and advocates the system of
expression used in this book. Hasselbalch
(1918) also proposed the same thing (Siggaard-Andersen
1967).
The actual pH, the PaCO2 (or [H2CO2] ) and non-respiratory pH are derived by measuring the blood pH and constructing the pH/PCO2 titration curve. This curve is approximately a straight line on pH/ log PCO2 coordinates. It is called a "buffer" line although "pH/log PCO2" line is a better description. The PaCO2 is read off at the point where the pH/log PCO2 line crosses the actual pH value:
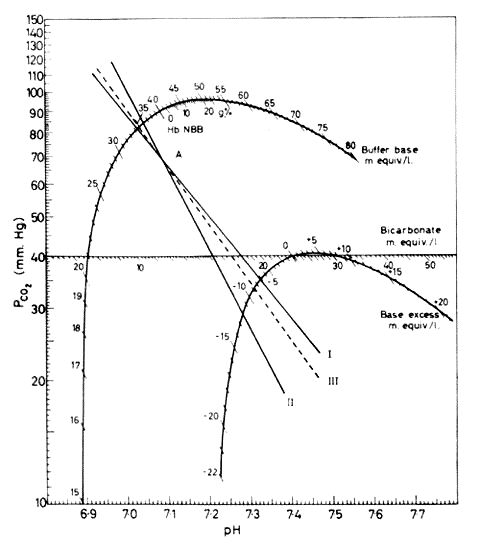
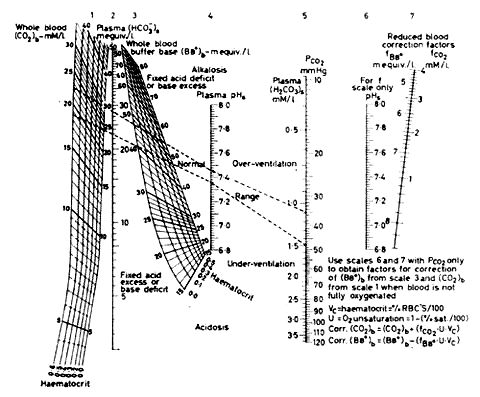
This is a PCO2-pH plot. I and II represent PCO2 - pH plots for two samples with pH 7.08 and PCO2 70mmHg. I is plasma. II is whole blood. III represents a similar plot for a fluid containing plasma but a haemoglobin concentration of 5g/100mls. The PCO2-pH plot can be constructed by plotting several pH's while altering PCO2. As the graph is approximately a straight line on log PCO2-pH coordinates, two points are usually sufficient. Alternatively, if one point on the plot is defined by measuring pH and PCO2 of anaerobically collected blood the line can be defined by determining its slope. When the slope is correct the reading on the Base excess curve will be equal to the reading on the Buffer base curve minus the number on the Buffer base curve opposite the Haemoglobin level in the blood sample, i.e. the Base excess read from the two curves will have to be the same.Figure copied from O.Siggaard-Andersen. Therapeutic Aspects of Acid-Base Balance from Modern Trends in Anaesthesia, 3rd Ed. F.T. Evans & T.C. Gray. Pub. Butterworths, 1967, p.102.
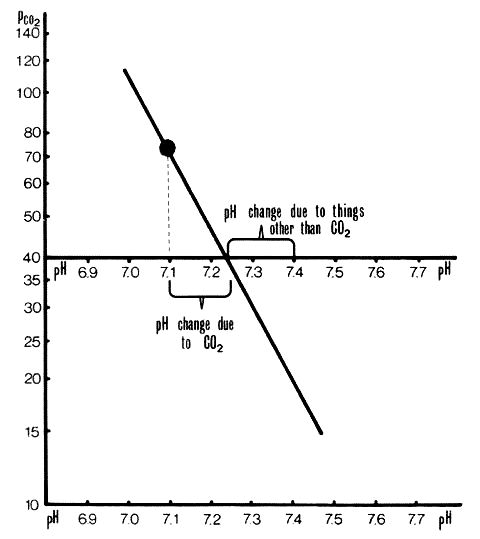
The non-respiratory pH is read off at the point where the line crosses the isobar PCO2 = 40mmHg - see Figures 2 and 3 below:
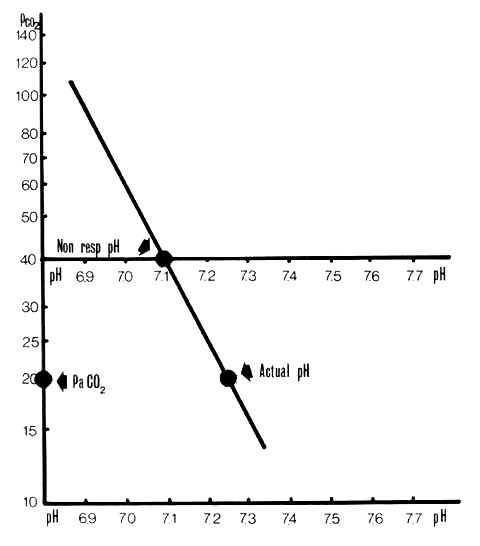
Figure 2 - Section 4.2.2.
Non-respiratory pH. A Siggaard-Andersen Nomogram on which a pH/PCO2 line has been plotted and the actual pH marked. Non-respiratory pH is where the pH/PCO2 line crosses the PCO2=40mmHg line. In this case it is 7.1.
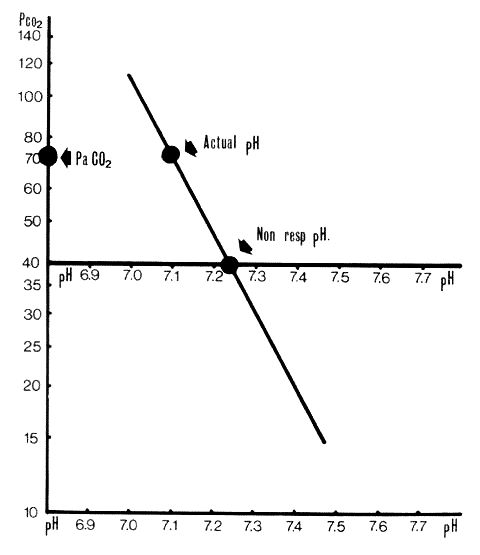
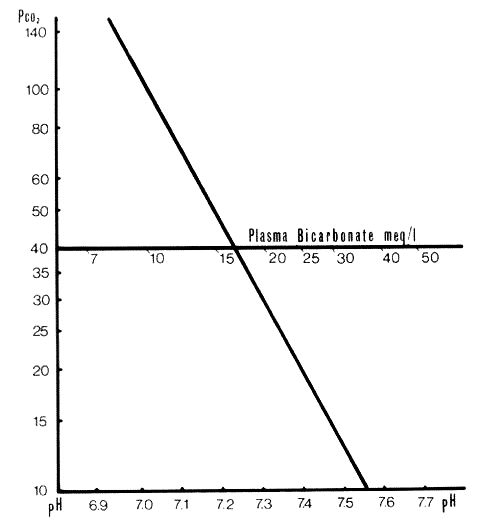
Non-respiratory pH plotted as in Fig. 2. In this case non-respiratory pH is 7.23 (approx).
7.4 minus non-respiratory pH equals the fall in pH due to acids other than carbonic or to bases (change in pH due to non-respiratory acids or bases). Non-respiratory pH minus actual pH equals the fall in pH due to carbonic acid (change in pH due to respiratory (carbonic) acid).
Negative results equal rises. (see figures 4 and 5 below)
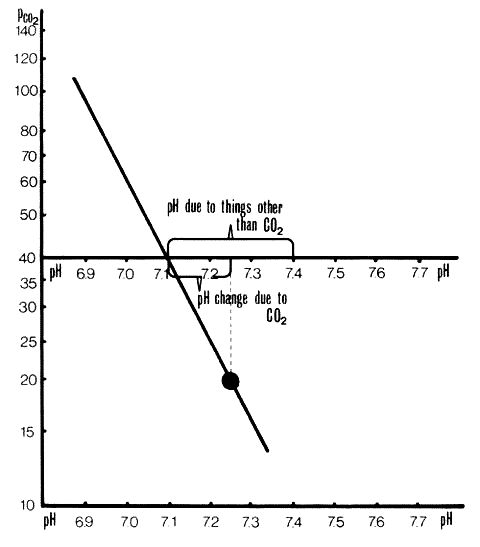
Separation of pH changes due to CO2 from those due to other acids or bases. This plot is the same as in Figure 2. pH change due to CO2 is +0.14 units. pH change to other acids and bases is -0.3 units.
Separation of pH changes due to CO2 from those due to other acids or bases. This plot is the same as in Figure 3. pH change due to CO2 is -1.3 units. pH change due to other acids or bases is -1.7 units.
SUMMARY
A. ACTUAL pH OF THE BLOOD MAY BE CHANGED BY CHANGES.
1. IN CARBONIC ACID, AND/OR
2. IN ACIDS OTHER THAN CARBONIC, OR IN BASES.
B. IF THE PCO2 IS CORRECTED TO NORMAL (40mmHg) THE RESULTING pH DEVIATION FROM 7.4 (7.4 MINUS NON-RESPIRATORY pH) IS DUE TO ACIDS OTHER THAN CARBONIC OR TO BASES.
C. ANY OTHER DEVIATION IN pH (NON-RESPIRATORY pH MINUS ACTUAL pH) IS DUE TO CARBONIC ACID CHANGES.
D. THE PRIMARY DISTURBANCE USUALLY PRODUCES THE GREATER CHANGE IN pH.
TABLE 4.2.2, showing possible combinations of actual pH, PaCO2 and non-respiratory pH.To show compatibility between this system and the base excess/standard bicarbonate system (Section 4.3), these parameters are also noted.
|
Actual pH |
PaCO2 |
Non-resp. pH |
Base excess |
Status |
||
|---|---|---|---|---|---|---|
|
|
|
|
|
Normal |
||
|
|
|
|
|
Acute resp.alkalosis(a) |
||
|
|
|
|
|
Chronic resp.alkalosis with renal compensation |
||
|
|
|
|
|
Chronic resp.alkalosis |
||
|
|
|
|
|
Non-resp. alkalosis with respiratory compensation |
||
|
|
|
|
|
Acute resp. acidosis(a) without compensation |
||
|
|
|
|
|
Chronic CO2 retention with compensation(b) |
||
|
|
|
|
|
Non-resp. (metabolic) acidosis with compensation |
||
|
|
|
|
|
Non-resp acidosis without respiratory compensation |
||
|
|
|
|
|
Complete compensation or |
||
|
|
|
|
|
Mixed disturbance |
||
|
|
|
|
|
Mixed respiratory & non-respiratory acidosis |
||
|
|
|
|
|
Mixed respiratory & non-respiratory alkalosis |
||
(a) Brackett et al (1965)
have shown that the in vivo pH-PCO2 curve
differs slightly from the in vitro curve. In vitro
PCO2 = 80mmHg gives a pH of 7.21 whereas in
vivo the pH is about 7.16. This corresponds to a non-respiratory pH
of 7.36, a base excess of -3meq/l and standard
HCO3![]() of 22 meq/l. The difference between the two curves is trivial
clinically. Although the slight apparent in vivo non-respiratory
acidosis is not a true non-respiratory disturbance, some change
between body compartments must occur for it to happen. (See Appendix
4.2).
of 22 meq/l. The difference between the two curves is trivial
clinically. Although the slight apparent in vivo non-respiratory
acidosis is not a true non-respiratory disturbance, some change
between body compartments must occur for it to happen. (See Appendix
4.2).
(b) Schwartz et al (1965) have tried to define what is the
"normal" actual HCO3![]() level in chronic hypercapnia. They conclude that if the
HCO3
level in chronic hypercapnia. They conclude that if the
HCO3![]() (and therefore actual and non-respiratory pH) level deviates from an
experimentally defined range some other complicating disturbance
apart from "normal" compensation has occurred, e.g. a non-respiratory
acidosis or alkalosis independent of the "normal" renal response to
CO2 retention. The experimental work was done
in dogs but even if we assume that it applies to man (Brackett
et al 1969), the clinical situation of CO2
retention is rarely "pure" and rarely is the degree of
CO2 retention constant. That is the initial
assumptions of these studies is wrong. (See Appendix
3.1).
(and therefore actual and non-respiratory pH) level deviates from an
experimentally defined range some other complicating disturbance
apart from "normal" compensation has occurred, e.g. a non-respiratory
acidosis or alkalosis independent of the "normal" renal response to
CO2 retention. The experimental work was done
in dogs but even if we assume that it applies to man (Brackett
et al 1969), the clinical situation of CO2
retention is rarely "pure" and rarely is the degree of
CO2 retention constant. That is the initial
assumptions of these studies is wrong. (See Appendix
3.1).
(There are at least 6 indirect
methods of assessing non-respiratory pH change. See Appendix
A4.3. Base excess and Standard
HCO3![]() are still in current use, and will be defined here. They can be read
off the Siggaard-Andersen nomogram. (Fig. 1 for
Section 4.3))
are still in current use, and will be defined here. They can be read
off the Siggaard-Andersen nomogram. (Fig. 1 for
Section 4.3))
This is obtained by solving the Henderson-Hasselbalch equation for [HCO2] when the pH is known and PCO2=40mmHg. 24.5meq/l = normal; >24.5meq/l = a high non-respiratory pH, <24.5meq/l= a low non-respiratory pH.
A Siggaard-Andersen Nomogram. Lines I, II and III represent pH-log PCO2 lines. I is separated plasma, II whole blood, III a mixture of extra cellular fluid and red cells with a haemoglobin of 5g/100mls. III corresponds approximately to the in vivo shape of pH/log PCO2 line.Standard bicarbonate is read off where the lines cross the bicarbonate scale superimposed on the PCO2=40mmHg line. The scale is derived by calculation from the Henderson-Hasselbalch equation. Figure copied from: O Siggaard-Andersen. Therapeutic Aspects of Acid-Base Balance from Modern Trends in Anaesthesia 3. Ed. F.T. Evans and T.C. Gray. Pub. Butterworths, 1967, p.102.
For more information see Appendix 4.3.1.
This is the number of milliequivalents of strong acid which has to be added to a litre of fully saturated blood at 37°C to bring its pH to 7.4 when the PCO2 = 40mmHg. 0 = normal, +ve figures = a high non-respiratory pH, -ve figures = low non-respiratory pH.
Base excess is read off where the lines cross the base excess curve which has been constructed empirically by titration of blood samples.
For more information see Appendix 4.3.6.
This is the difference between the sum of the cations and the measured anions., e.g.:
Na= 140meq/litre, K
= 25meq/litre, Cl
Anion gap = 140 + 4 - 25 - 100 = 19meq/litre.
The Anion Gap increased when organic acids are increased.
Calculating the anion gap is of some value in detecting laboratory errors in pH parameters. (Thomas et al, 1973). It is also of value in differentiating the cause of a pH disturbance. The anion gap will be increased if there is an increased amount of lactic acid (ie an unmeasured anion) in the blood, but not if added hydrochloric acid or loss of base (e.g. severe diarrhoea) is the cause of low pH. (Oh and Carrol, 1977, Leading Article, 1977).
For more informatiOn see Appendix 4.3.6.
When CO2 is added to the body in vivo, the
pH initially changes less in blood than in the interstitial fluid.
Blood contains a considerable amount of protein which takes up
H![]() leaving the base HCO3
leaving the base HCO3![]() . The interstitial fluid contains very little efficient buffer,
therefore, its pH changes more when CO2 is
added. H
. The interstitial fluid contains very little efficient buffer,
therefore, its pH changes more when CO2 is
added. H![]() cannot be taken up as readily by the interstitial fluid and its
[HCO3
cannot be taken up as readily by the interstitial fluid and its
[HCO3![]() ] rises less than does that of the blood. If blood and
interstitial fluid are allowed to equilibrate the pH will be between
that of blood and interstitial fluid in vitro; so will the
[HCO3
] rises less than does that of the blood. If blood and
interstitial fluid are allowed to equilibrate the pH will be between
that of blood and interstitial fluid in vitro; so will the
[HCO3![]() ] . In the body there is also intracellular fluid which contains
protein and phosphate buffer pairs. So there are three main
compartments in equilibrium. The end result is that when the
PCO2 changes in blood in vivo the pH of blood
changes more than when the PCO2 is changed in
blood in vitro.
] . In the body there is also intracellular fluid which contains
protein and phosphate buffer pairs. So there are three main
compartments in equilibrium. The end result is that when the
PCO2 changes in blood in vivo the pH of blood
changes more than when the PCO2 is changed in
blood in vitro.
(See note (a) to table 4.2.2 for magnitude of the differences between in vitro and in vivo curves).
(This section was omitted from the main text as these methods are
redundant and give no useful information not carried in the
non-respiratory pH. Only Base Excess and Standard
HCO3![]() are still commonly used, although other forms of
HCO3
are still commonly used, although other forms of
HCO3![]() may be the test done in "serum electrolytes".)
may be the test done in "serum electrolytes".)
Equations E.4.3.2 and E.4.3.3 are forms of the Henderson-Hasselbalch equation, it is derived from the dissociation equation.
H2CO2H
K is a lumped constant which allows for the fact that most of the dissolved CO2 is not in the form H2CO2 (for discussion of the equation, see Appendix 2.4.1 and Chinard 1966).
![]()
Equation 4.3.3
In equation E.4.3.3 if PaCO2 is made
constant at 40mmHg measuring
[HCO3![]() ] would give the same information as measuring the
non-respiratory pH. If PCO2 = 40mmHg, pH is a
function of [HCO3
] would give the same information as measuring the
non-respiratory pH. If PCO2 = 40mmHg, pH is a
function of [HCO3![]() ]
or,
]
or,
Even if PCO2 is not 40mmHg the
[HCO3![]() ]
would not change greatly in the physiological range (see Appendix
2.4.1) therefore [HCO3
]
would not change greatly in the physiological range (see Appendix
2.4.1) therefore [HCO3![]() ] can be used as a measure of non-respiratory disturbances
(Peters and Van Slyke,
1931)
] can be used as a measure of non-respiratory disturbances
(Peters and Van Slyke,
1931)
[HCO3![]() ]
was estimated by a number of tests in which strong acid was added to
blood samples. CO2 from
HCO3
]
was estimated by a number of tests in which strong acid was added to
blood samples. CO2 from
HCO3![]() and H2C03 was evolved
and measured. [HCO3
and H2C03 was evolved
and measured. [HCO3![]() ] was calculated from this. These methods were convenient before
pH electrodes were readily available.
] was calculated from this. These methods were convenient before
pH electrodes were readily available.
There are at least four forms of bicarbonate that have been used. There is controversy regarding the relative value of these (Leading Articles, 1963, 1965). The argument has no rational value as the same conclusions can de derived from any of the methods when there is a substantial change.
Standard Bicarbonate is a common way of expressing non-respiratory
pH abnormalities. This is defined as the bicarbonate in the fully
saturated blood at 37°C when the PCO2 is
40mmHg. This can be calculated by solving the Henderson-Hasselbalch
equation for [HCO3![]() ],
having measured the non-respiratory pH.
],
having measured the non-respiratory pH.
On the Siggaard-Andersen nomogram the standard bicarbonate has been plotted on the line where PCO2 is 40mmHg. The values are derived by calculation from the Hendersen-Hasselbalch equation. There is a unique value of standard bicarbonate for each value of non-respiratory pH. See Fig.1, Section A.4.3.1, below:
Standard bicarbonate is calculated from the Henderson-Hasselbalch equation with PCO2 fixed at 40mmHg. This results in a table of [HCO2]-pH. The values of [HCO3
The alkali reserve or CO2 combining power
is the bicarbonate in "serum electrolytes" in some hospitals. The
serum is equilibrated at room temperature with a
CO2 of near 40mmHg. Excess HCl is added and
CO2 is evolved and measured.
[HCO3![]() ] is calculated from the volume of CO2
evolved.
] is calculated from the volume of CO2
evolved.
There are technical problems in this test. The blood is not
separated at the temperature or PaCO2 level of
the patient. There would be a slight variation in "alkali reserve"
depending on the day temperature and whether the
[CO2] has dropped in the sample before
it was separated. All the same, if there is an appreciable change in
the standard bicarbonate there will also be an appreciable similar
change in the serum HCO3![]() .
.
This is measured by subjecting anaerobically collected whole blood
to acid treatment and measuring the CO2
evolved. This differs from the serum HC03 in that it measures
CO2 + HCO3![]() as they occurred in the patient. As the CO2 is
a small part of the CO2 +
HCO3
as they occurred in the patient. As the CO2 is
a small part of the CO2 +
HCO3![]() in the blood, the total CO2 will be slightly
greater than the actual bicarbonate.
in the blood, the total CO2 will be slightly
greater than the actual bicarbonate.
The actual bicarbonate can be calculated from the total CO2 if PCO2 or pH is also measured (See (Appendix 2.4.1).
If PCO2 has been measured:
If pH has been measured then PaCO2 can be calculated using the following form of the Henderson-Hasselbalch equation:

and the actual bicarbonate determined by using E.4.3.4.1.
N.B. Although there are differences in Standard
HCO3![]() , alkali reserve, total CO2 and the actual
HCO3
, alkali reserve, total CO2 and the actual
HCO3![]() ,
a large change in any will be accompanied by a large change in the
same direction in the others.
,
a large change in any will be accompanied by a large change in the
same direction in the others.
Total Buffer-Base is the meq base/litre of blood. According to
Singer and Hastings (1948) buffer-base =
HCO3![]() + protein anions.
+ protein anions.
The Singer-Hastings nomogram from which total buffer-base is
derived, was constructed using pH and PCO2,
haematocrit, together with laboratory data on buffering power of
haemoglobin and plasma proteins at various pH's. The scales on the
nomogram are pH, PCO2,
HCO3![]() , buffer base, total CO2. As the only data
required to use the nomogram are any two of pH,
PCO2, HCO3
, buffer base, total CO2. As the only data
required to use the nomogram are any two of pH,
PCO2, HCO3![]() or total CO2 plus haematocrit level. Northing
is achieved by using it.
or total CO2 plus haematocrit level. Northing
is achieved by using it.
When interpreting buffer-base the haemoglobin has to be taken into account. If the buffer-base is raised for any given haemoglobin level, so is the non-respiratory pH and vice versa. Buffer-base is therefore a redundant parameter. Any rise in the buffer base is the base excess (A.4.3.6). See Figure 1 for Section A.4.3.5. below:
From this diagram the "buffer-base" can be read for a given haematocrit if pH and PaCO2 are known. From Singer, R.B. and Hastings, A.B. "Improved Clinical Method for Estimation of Disturbances of Acid-Base Balance of Human Blood", Medicine, 27, 223; 1948.
Base excess is the commonest parameter used to express non-respiratory pH disturbances. There are two definitions:
a) Base Excess = the quantity of strong acid which has to be added to a litre of fully saturated blood at 37°C to bring its pH to 7.4 when PCO2 is 40mmHg.(Siggaard-Andersen, 1960).(-Base = +Acid).b) Base excess = Actual total buffer-base - normal total buffer-base (Singer and Hastings, 1948). (See Appendix .4.3.5).
The base excess curve on the Siggaard-Andersen nomogram was constructed experimentally using the first definition (Figure 1 for Appendix.4.3.6). To find the point -10meq/l on the base excess curve of the Siggaard-Andersen nomogram (1962 version) 10meq HCl/litre was added to bloods of varying haemoglobin levels. A pH- log PCO2 line was plotted for each blood sample. The pH- log PCO2 lines for the various haemoglobins crossed at the -10 point. The process was repeated for other quantities of acid and alkali. The points were joined to produce the base excess curve. The base excess of any other sample of blood can be found by constructing its pH- log PCO2 line and reading off the base excess where the line crosses the base excess curve. It is of interest that only four different bloods were used to construct the nomogram (Siggaard-Andersen, 1962).
Base excess is independent of haemoglobin because of the method of constructing the curve. The other parameters of acid-base expression are not independent of haemoglobin. The importance of this independence is slight except in the case of total buffer base. The inconvenience and lack of meaning of the absolute values of total buffer-base was the original reason for deriving the base excess.
At first it was said that from the base excess one could calculate the quantity of acid or base which would be added to the whole body to correct non-respiratory disturbances in pH. Two formulae were proposed by Astrup et al (1960):
1. Dose of NaHCO2 required to neutralise extra-cellular fluid = - (Base excess x body weight Kg x 0.03) meq.2. Dose of NaHCO2 required to neutralise the whole body water = -(Base excess x body weight x 0.7) meq.
No data were presented to justify the formulae in that paper. Other work by Mellemgaard and Astrup (1960) is not adequate to establish clinical validity of the formulae.
Clinically the formulae are not very useful because:
i) Acid-Base disturbances are usually not static.ii) Base excess is a measurement on blood. It may not apply accurately to extracellular fluid. It does not reflect directly intracellular changes.
iii) There may be differences in severity of pH changes in various body compartments (e.g. compare lactic acidosis with acidosis of intestinal obstruction (Van Slyke, 1966) ).
If one decides to correct base excess by giving acid or base (0.1 x body weight Kg x base excess) meq does not usually over-correct the disturbance. Chemical response to the first does will give a guide to further doses.
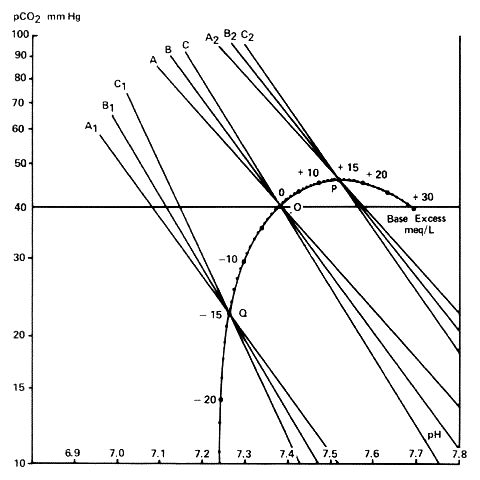
This is figure 2 from Siggaard-Andersen, O. and Engel, K. "A New Acid-Base Nomogram", Scand.J.Clin.& Lab.Invest. 12, 177; 1960. Figure Copyright Radiometer, Copenhagen, Denmark.Construction of base-excess curve. A, B & C are pH/log lines. A is blood with no haemoglobin, i.e. plasma, B has a haemoglobin level 10G/100ml, and C a haemoglobin of 20G/100mls. A,B & C are the same lines after adding 15meq acetic acid; A2, B2 and C2 after adding 15meq sodium carbonate. The points of intersection of A, B and C for each quantity of acid or base added defines points on the base-excess curve.
If a non-respiratory acid or base is added to or removed from
blood all the following change: non-respiratory pH, standard
HCO3![]() , actual HCO3
, actual HCO3![]() , serum HCO3
, serum HCO3![]() , total CO2, total buffer-base and base
excess. Serum HCO3
, total CO2, total buffer-base and base
excess. Serum HCO3![]() measurement is more liable to variability than the other parameters.
Major changes in any of these parameters will be associated with
comparable similar changes in the others. In vitro measurements
differ slightly from in vivo if the PaCO2 is
markedly abnormal.
measurement is more liable to variability than the other parameters.
Major changes in any of these parameters will be associated with
comparable similar changes in the others. In vitro measurements
differ slightly from in vivo if the PaCO2 is
markedly abnormal.
In any uncharged solution the total concentration of positive
ionic charges equals that of negative charges. This is referred to as
electrical neutrality. In serum the cations (positively charged ions)
are mainly Na![]() and K
and K![]() .
Together they equal about 145meq/litre. [H
.
Together they equal about 145meq/litre. [H![]() ]
is around 40 x 10 -9 eq/litre, so is negligible in measurements of
ionic balance. The other cations, e.g. Ca
]
is around 40 x 10 -9 eq/litre, so is negligible in measurements of
ionic balance. The other cations, e.g. Ca![]() ,
Mg
,
Mg![]() ,
Zn
,
Zn![]() etc., are present in small ionic concentrations.
etc., are present in small ionic concentrations.
It should be noted that Ca, Mg and Zn have a valency of 2 so that the ionic equivalent will be twice the molar concentration.
The anions which must balance the quantity of cations are
Cl![]() and HCO3
and HCO3![]() which are usually measured, together with
S04
which are usually measured, together with
S04![]() , HP04
, HP04![]() , organic acid anions (lactate, keto-acid anions) and protein anions
which are not usually measured. Unionised acids are not relevant in
ionic balance.
, organic acid anions (lactate, keto-acid anions) and protein anions
which are not usually measured. Unionised acids are not relevant in
ionic balance.
The anion gap is usually taken to mean [Na![]() ]
+ [K
]
+ [K![]() ]
- [Cl
]
- [Cl![]() ]
- [HCO3
]
- [HCO3![]() ].
This is positive as there is less unmeasured cation than anion. There
will be appreciable expansion in the gap when pH changes are due to
changes in acids which result in increases in unmeasured anions, e.g.
sulphuric or lactic acid.
].
This is positive as there is less unmeasured cation than anion. There
will be appreciable expansion in the gap when pH changes are due to
changes in acids which result in increases in unmeasured anions, e.g.
sulphuric or lactic acid.
Fig.1 in Section A.4.3.7 shows the relative sizes of the ionic concentration of the ionic components of blood plasma. Interstitial fluid and cellular fluid.
In conventional usage a high anion gap suggests an organic acidosis or renal failure-related acidosis. A non-respiratory acidosis with a normal anion gap suggests hydrochloric acid-related disturbance. Adrogue et al, 1978, found that hydrochloric acid-related pH changes in dogs were associated with a change in anion gap. An acidosis was associated with low anion gap and vice versa. Madias et al, 1979, report two cases of alkalosis associated with high anion gaps.
The use of anion gap in a positive diagnostic role would appear to be unwarranted. Its main use should be to draw attention to possible pH disturbances and to corroborate pH and electrolyte measurements.
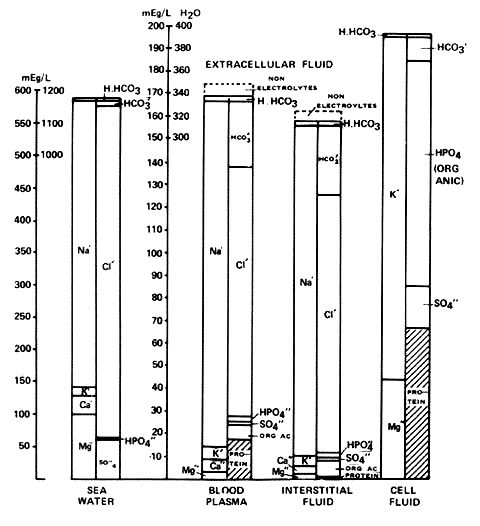
Chart 2 from Gamble, J.L., Chemical Anatomy, Physiology and Pathology of Extra-Cellular Fluid, Harvard University Press, Cambridge, Massachusetts, 1951.Diagram of blood plasma, interstitial fluid and cell fluid showing the ionic concentration of the components. The lower parts of the plasma and interstitial fluid show the usually unmeasured ions.
There are a number of concepts in the field of acid-base chemistry which draw a veil of obscurity across some simple, almost self-evident ideas as expressed in Sections 4.1 and 4.2.
The pH of blood in normal man lies between 7.35 and 7.45 and the PCO2 35mmHg and 45mmHg.
The pH may be altered by a change in the quantity of CO2 dissolved in the blood or by adding or subtracting some other acids or bases; or it may be due to a change in both these variables.
Any pH change which is not due to a CO2 change is due to an alteration in some other acid or base.
By artificially adjusting the PCO2 to normal 40mmHg, in vivo or in vitro, any pH change due to acids or bases other than carbonic can be deduced.
Appreciable or important or interpretable differences between the in vivo and the in vitro assessments of pH change do not occur. There are differences between the in vivo and in vitro but they are small and do not cause confusion in the clinical situation. I suspect the interpretations placed upon these differences in the animal laboratory situation. I have not yet found any instance where such laboratory results could not be made to fit into the framework outlined in this book.
Numerous attempts have and are still being made to "simplify" the understanding of acid-base disturbances by various graphic and statistical manipulations on the simple measurements which are actually made in the laboratory, i.e. pH and PCO2. The more recent ones include Slonim, 1970; Goldberg et al, 1973; Rispens et al, 1973; Magalini, 1973; Fulop et al, 1974; Howarth, 1973; Leading Article (b) 1974; Howarth, 1974 and Tartulier et al, 1973.
It is very likely when numerous conflicting claims are made for different solutions to the same problem that none of the attempts approach a simple satisfying coherent description of the problem.
If the actual measurements made are pH and PCO2, there can be no information contained in the presentation of the results that is not contained in the original information.
If the final deductions can be made from the pH and PCO2 and the relationship between these two parameters then it appears to me that presentation of other derived parameters is at best useless and redundant, and at worst confusing and a means for making the reader think that he has fundamental deficiencies in his or her knowledge.